The 2016 Tableau Partner Summit in Austin, TX drew 400 people last week from all over the country, including members of our veteran business intelligence consulting team.
We always love attending this event because people who have passion for helping businesses visualize data in insightful ways are there, and the Tableau innovation pipeline always reveals something interesting.
Here are three things that jumped out at us that we think will help you get better at visualizing performance in your business.
1. To maximize your audience’s insight from data, design for how the mind processes information.
Tableau’s Director of UX, Jeff Pettigross, walked us through the science behind Charles Minaud’s masterpiece graphic of Napoleon’s attempted conquest of Russia, made famous in recent years by Edward Tufte:
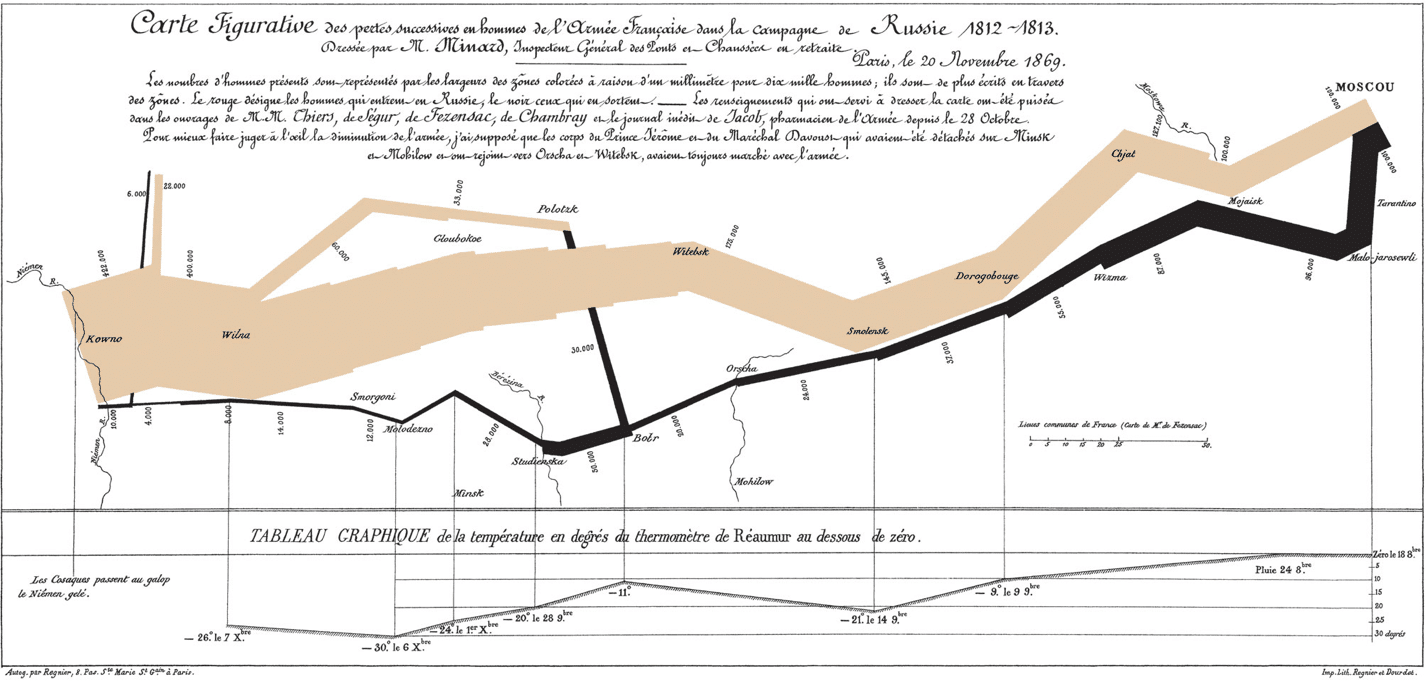
By Charles Minard (1781-1870) – see upload log, Public Domain, https://commons.wikimedia.org/w/index.php?curid=297925
It turns out that the way objects are placed in a visualization significantly influence how the brain processes information. Here are different ways to think about it:
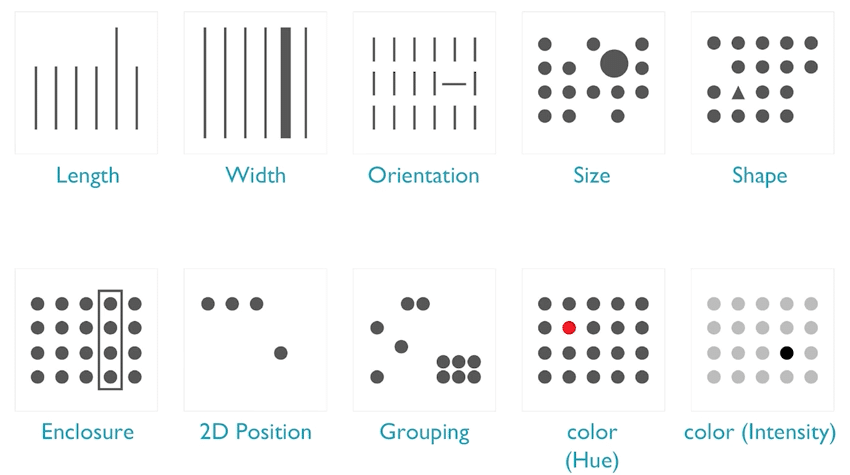
Minard’s visualization uses position, which is one of the fastest ways for our brains to communicate data.
Pettigross’ talk reinforces the value of transforming data from numbers in a table to a visualization that sparks rapid insight in the brain. And it’s valuable for any audience, whether an internal project management team or prospective customers in a sales meeting.
And, interestingly, this principle isn’t one that requires Tableau. Rather, Tableau’s value proposition is to make it easier to apply it to your data.
You can watch his talk (runs 21 minutes) below:
2. Tableau makes data science analysis more accessible and simplifies statistical modeling.
Increasing numbers of businesses want more out of their data than performance monitoring. They want to predict what will happen in the future based on what trends they see in their business today. Tableau now allows analysts to use an advanced statistical package. The software includes seamless integration of R right within the Tableau desktop application.
In case you are unfamiliar, R is a programming language and software environment that allows advanced statistical modeling and analysis. We have had many reporting projects over the years that combine statistical reports and standard reporting, and we are big fans of R. Presenting statistical reporting from R alongside standard performance reporting has traditionally required fairly complex, time-consuming development. But with R integration in Tableau, not only can you easily visualize statistical modeling, you can embed R code right in the tool. We can’t wait to get this in place for our customers who do advanced statistical analysis.
3. Tableau makes it easy for business users to analyze their data, but be aware of new challenges.
The concept of the Citizen Developer has stormed onto the scene in recent years. It refers to the rise of software that enables non-technical people to develop technology and reporting applications previously reserved for technical developers – “DIY Development,” so to speak. Tableau is a leading example in the business intelligence arena of democratizing data analysis.
A new challenge has arisen from this trend, which is that business users without technical training often don’t consider that the design of a report can have implications on performance. For example, it can cause the simple step of updating a report to take more than a minute when it could take seconds.
Technical business intelligence developers call managing this risk “performance tuning.” Tableau helps users address performance by including a feature called Performance Recording. This feature can be found under the Help context and records events including:
- Query execution
- Geocoding
- Connections to data sources
- Layout computations
- Extract generation
- Blending data
- Server blending (Tableau Server only)
The output of this operation is itself a Tableau workbook that includes performance metrics and can provide extremely helpful insight into the execution of a report. Utilizing this tool helps users understand the operations being performed by running reports and can save significant time and frustration.
Overall, it was another great Tableau Partner Summit. With a great blend of visualization strategy discussion and technical ins and outs for getting the most out of Tableau, we are looking forward to helping our customers get the most out of their data with creative and insightful visualizations in 2016.
###
To get started using Tableau for free, download a free trial here.