When you begin working with Tableau and you see the extensive list of data source connections the first time you fire it up, it’s hard not to think, “Let’s throw them all together and see what we get!”
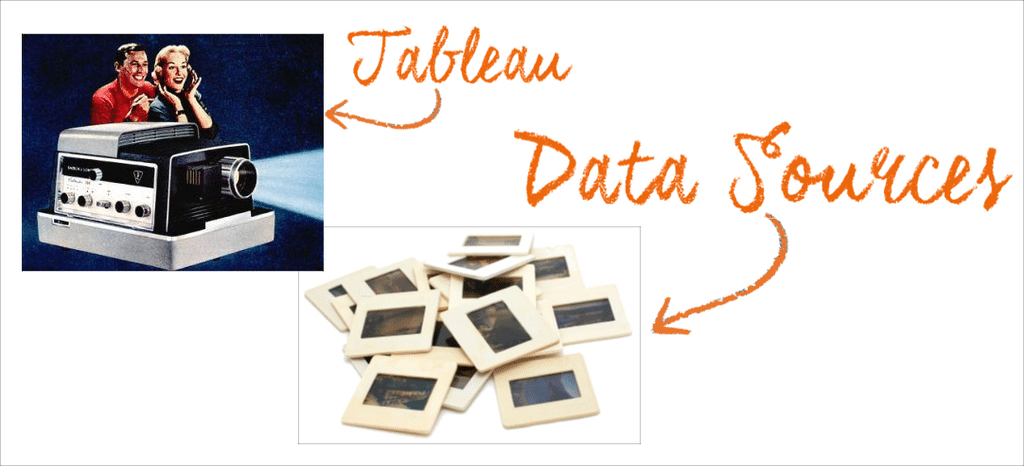
Tempting, I know, but think of data blending in Tableau as “…an old-school slide projector for your data where each Tableau data source is a slide.” Born initially out of a hackathon among Tableau engineers, it’s a clever way to place more than one slide in the projector at once. Taking that data from multiple data sources and blending them on a single worksheet using common joined dimensions sounds ideal. What happens, though, if we put too many slides in or they overlap?
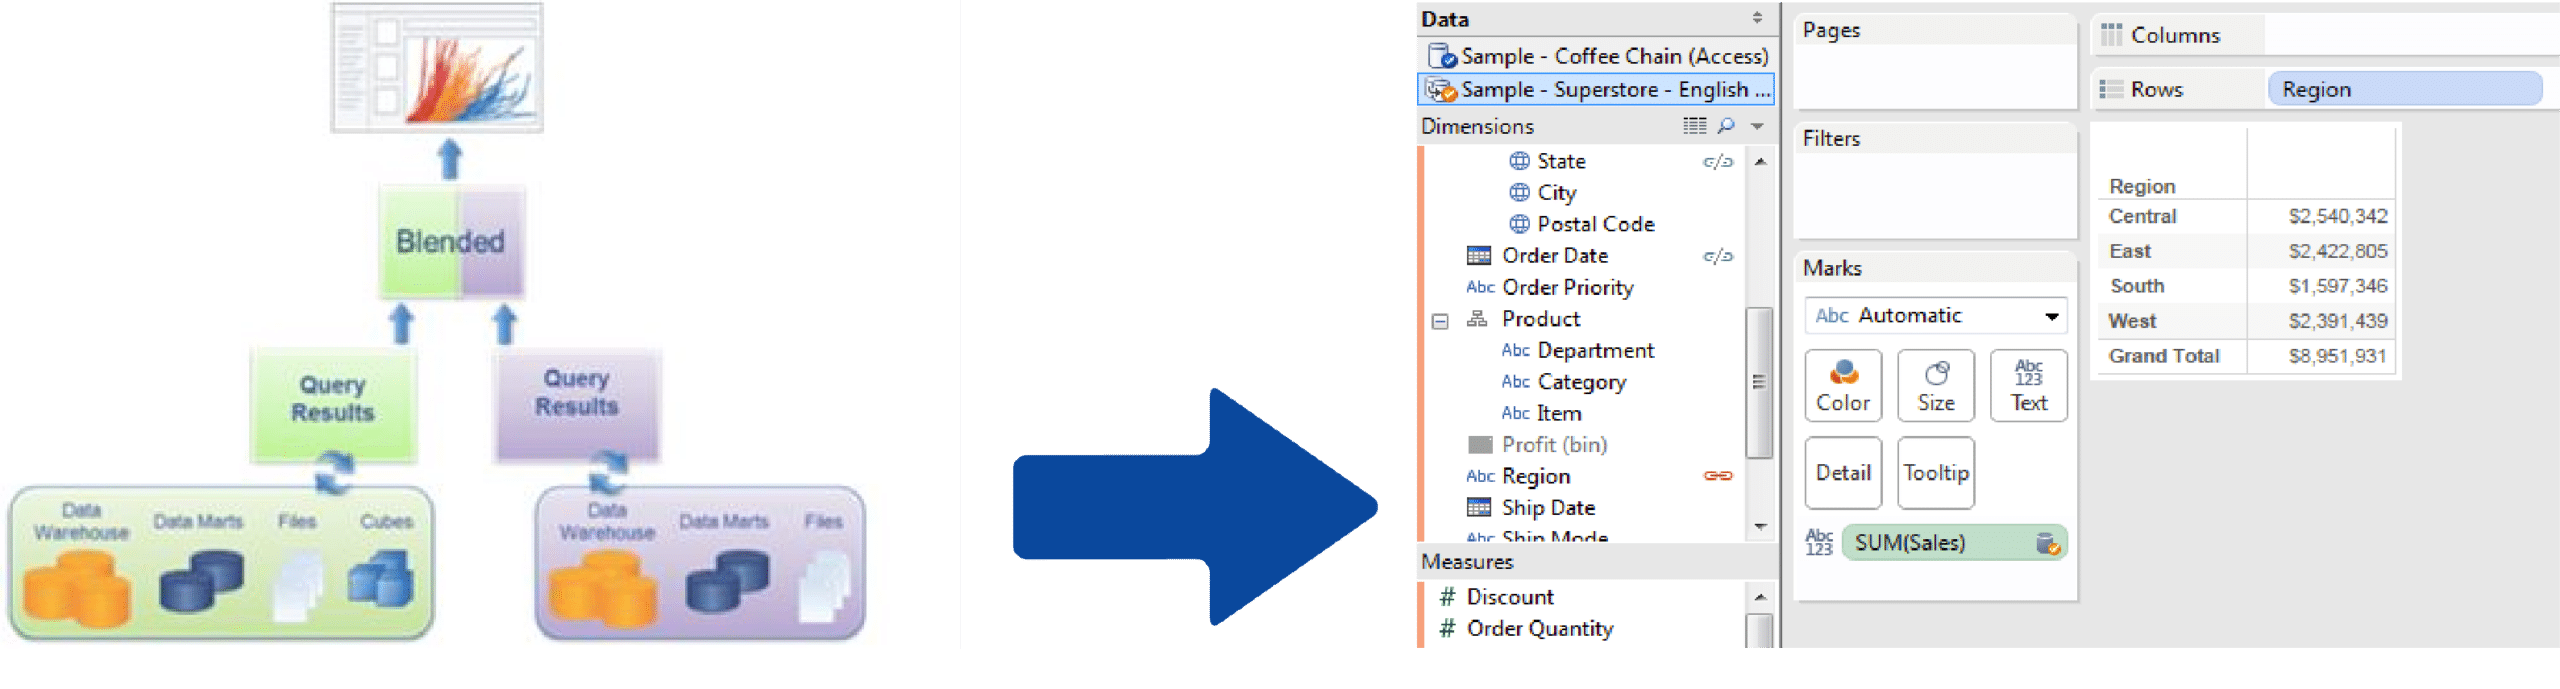
To integrate data, you must first define common dimensions between the primary and secondary data sources. For example, when blending Actual and Target Sales data, the two data sources may have a Region field in common, which must be specified as a linking field (automatically or defined). For each data source that is used, a query is sent to the database and all results are left joined on the common dimensions. With this left join, the view uses all the data rows from the primary data source, but only those data rows that have values for fields that are in the view or used in fields that are designated as linking fields.
“When to Blend” by Keith Helfrich, http://redheadedstepdata.io/when-to-blend/.
So what is this good for then? Data blending is wonderful for one-off analyses, proofs of concept, or quick-wins where speed is the main advantage. Want a fast and easy way to connect a table of Salespeople to Sales Region? BLEND IT. Want to compare aggregated sales to a single quota? BLEND IT. If you have common fields in two different sources and want to put together a quick check for correlation, give data blending in Tableau a shot.
Notwithstanding the above examples, most Tableau gurus would agree to do all or most data modelling in the database or ETL layer before connecting to Tableau. Disparate data often shows up on your doorstep with a variety of levels of detail. Requirements are complex and building a dashboard with multiple facets that cross can lead to an analyst meltdown. Blending is often great, but can be troublesome, so if you find you have too many slides in your projector or the data just doesn’t look right, think data preparation. The goal of data prep is to unify your various sources into a single, tidy data set; i.e., one slide for your projector.
Here are some alternatives:
1. Alteryx
A Swiss-army knife of a tool that enables customized and intuitive data manipulation pipelines. Many data workers view it as the tool of choice prior to visual analysis in Tableau. 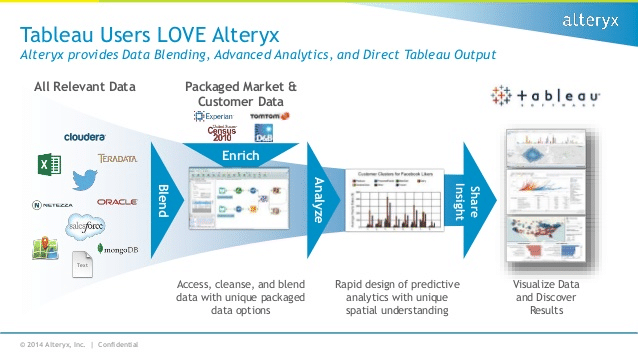
2. SQL + Scripting Languages
What Alteryx does via point-and-click interface, a talented analyst could do for FREE with SQL, Python, or other data manipulation languages.
3. Case Statements
This technique will simply rename your secondary dimensions if they are just labels for your primary dimensions with a calculated field. Take a look at this creative solution from DataBlick Joe.
Data blending in Tableau is often great, but when it fails on you, get prepared. A few data preparation steps will keep your visual analysis in the clear and you’ll see the big picture. Happy blending!
(For more information, head over to Keith Helfrich’s blog, redheadedstepdata.io.)
###
To get started using Tableau for free, download a free trial here.