Content provided by: Chris Mahaffey and Nathan King
In your business, you undoubtedly rely on key metrics like revenue or profit margin as indicators of business health, but when it comes to getting insight from data into how to improve your business’ health, those metrics don’t provide much value. InfoWorks Business Intelligence and Analytics Practice helps our clients dig into the data routinely, helping to uncover the metrics that tell the story of the business.
To illustrate, let’s look at a data example from Vanderbilt baseball. The Vanderbilt baseball team perennially ranks among the best in the country, and as a part of the SEC, with seven teams currently ranked in the top ten, it is no exaggeration to say that we’ve got some of the best college baseball in the world here in Nashville. Many Vanderbilt alumni work at InfoWorks, and we won’t deny being fans.
In our Business Intelligence and Analytics Practice, being a fan means more than attending games and rooting on the team. Our “gear” goes beyond hats and t-shirts. We’ve got our own baseball statistics database.
We’ve followed another solid season here in 2016 – the team is ranked 6th nationally – and we have huge hopes for greatness. We look at this situation and ask ourselves, what could be some small areas that Vanderbilt could focus on to improve its overall performance?
The typical armchair fan might focus on the offense and start by reviewing the team’s performance through batting average. That isn’t how baseball works and it paints an incomplete picture. A more effective approach would be to evaluate where smaller adjustments could be made.
The story we’ve seen in performance has us exploring the data, and we’ve looked at a combination of several metrics:
- Batting average
- Runs scored
- Batting average on balls in play (BABIP)
- Contact percentage
- Walks and strikeouts as a percentage of plate appearances
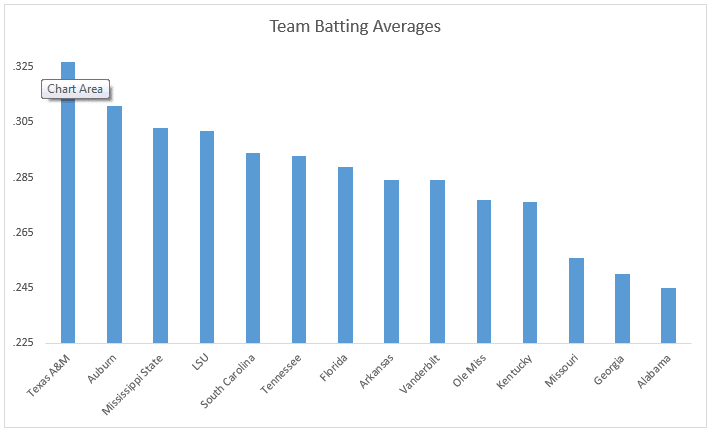
Now we start building up from there. Runs flow from getting on base, which comes from a number of areas, but especially from hits. Batting average is the standard indicator here. Vanderbilt results are fairly average, and don’t reflect an elite team:
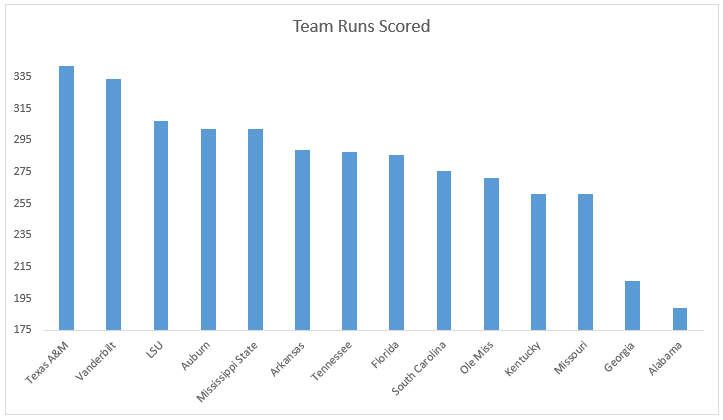
But Vanderbilt is elite at scoring runs, behind only Texas A&M, ranked #2 in the country:
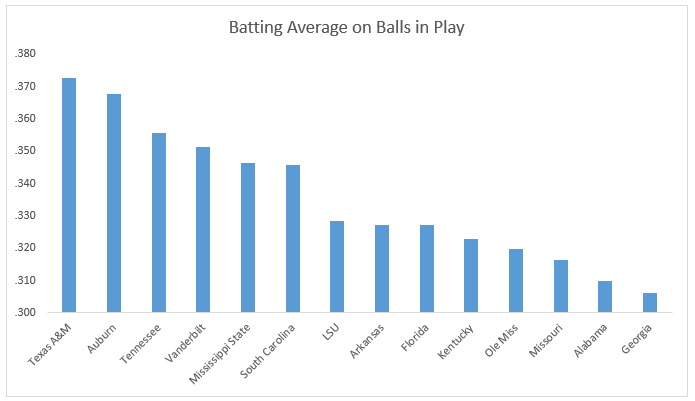
This is where it gets interesting. Vanderbilt generates impressive run production from average hitting. What could explain that? A lesser known metric to the casual fan, but one that followers of Sabermetrics or fantasy baseball will know, batting average on balls in play (BABIP) has Vanderbilt ranked among the top 4 teams:
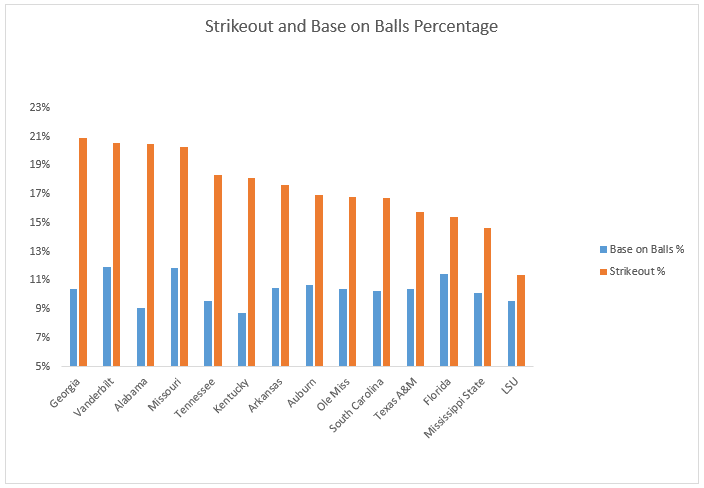
The second characteristic we see is that there are a lot of walks and a lot of strikeouts on the team:
We infer from these two stats that Vanderbilt hitters are taking pitchers into deep counts. This is likely a strategic decision for the entire team, as coaching players to be highly selective forces teams to go to the bullpen sooner while waiting for the right pitch.
But we see something revealing here. Vanderbilt has far too many strikeouts, and when contact is made, the batting average is good. Thus, we wonder if there is an opportunity for Vanderbilt players to be more aggressive. The data suggests that there is.
This exercise demonstrates how exploring data can lead to deeper insights. Multiple metrics are essential for teasing out small areas of business to improve.
In our example, the isolated area for improvement is an adjustment at the plate, perhaps a relatively simple one like attacking pitches more aggressively, which could ultimately result in a sizable impact on run production, a deeper post season, and perhaps even another trip to the College World Series in June.


