The Importance of a Business Dashboard
Imagine climbing in your car, merging onto the interstate, and suddenly realizing that your dashboard went out. When you drive past a police officer, how will you know if you are going the speed limit? You think you have enough gas to get to work, but you don’t remember the last time you filled up. Your car has been having some cooling problems lately, but now you won’t know if your car is about to overheat until it’s too late and smoke starts billowing from under the hood. How can you address these potential problems in the midst of your morning commute without your dashboard?
The importance of a car dashboard is obvious but often taken for granted. Like a car dashboard, a business dashboard can tell your leadership team and employees vital information about the performance and operations of your business. In other words, a business dashboard is a visual compilation of real time metrics, processes, and business drivers that can help prevent your business from crashing and burning. This compilation should be easy to read and comprehend so a business leader or an employee can get a visual picture of the company’s health or performance in a concise and readable format.
So what kind of information should you put on your dashboard? Choosing the right information that is displayed on a dashboard is probably the most critical part of dashboard implementation. To bring back the car analogy, there is a reason why you only see certain information on your car dashboard. What if your car dashboard displayed how much life is in your power windows motors? Although you might personally care about this information, if the power window motor breaks, although inconvenient, it will not affect the performance of the vehicle and the overall vehicle objective, which is to get you from point A to point B. Also, there is valuable dashboard real estate that is being taken by an innocuous indicator. Similarly, you should not put just any old metric on your dashboard to analyze, but key metrics, otherwise known as key performance indicators. These KPI’s will be different for different businesses and organizations and will even vary by department or business unit, as each unit could have unique business drivers that need to be tracked. Even different levels of employees at a business may use different types of dashboards depending on their specific needs.
Balanced Scorecard and Strategy Map
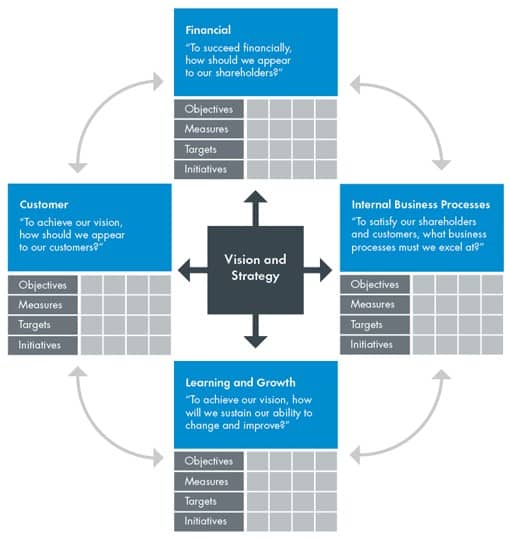
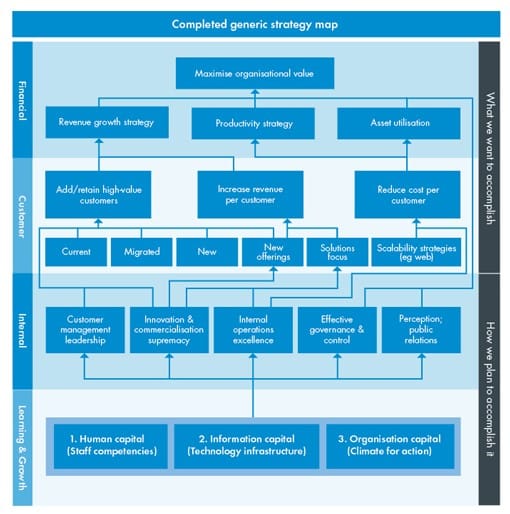
A balanced scorecard is a strategy performance management tool that contains a mixture of financial, internal, customer, and learning and growth key performance indicators. In order to create the most relevant balanced scorecard for your organization, it is best to conduct a “strategy mapping” session to ensure that the most relevant KPI’s are selected for your dashboard. A strategy map diagrams the company’s strategy across the aforementioned indicators—financial, internal, customer, and learning and growth. Both tools can be used independently, however, we have found that using them in conjunction when creating KPI’s yields the most impactful KPI’s.
Types of Dashboards
Analytical dashboards are used by executive and senior managers to assure that the company is moving towards its goals and objectives. These dashboards are often used to set and establish targets as many times they look to drive the big picture strategic direction of an organization. These dashboards generally collect data over an extended time to track progress, can help give insight into why a company was performing a specific way, and can assist in giving leaders information on what changes they may want to make.
Operational dashboards are used by front line managers and employees to assess and measure performance. Employees can monitor and immediately see the impact of specific actions taken on KPI’s and re-adjust as necessary. These dashboards generally focus on the day-to-day tactical picture and are often tied in to objectives and goals of front line staff.
Putting the Dashboard to Work
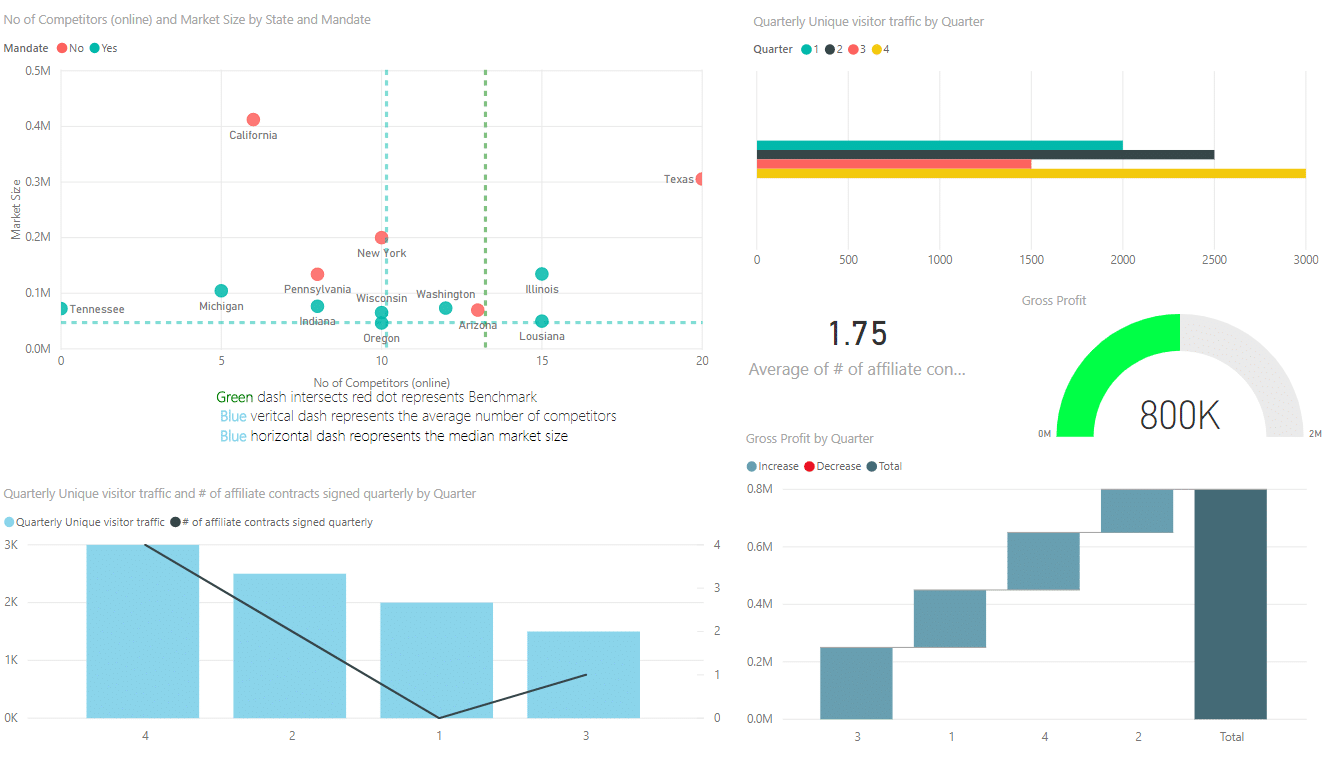
On the above dashboard, I would like to call your attention to the top left visual of figure 3. The above business was actively planning to enter into new markets. Their previous expansion strategy was based on fragmentary data and hunches. Before the dashboard was implemented their first new market was going to be Texas. Their reasoning behind Texas was that it had a big population, it was similar to their current market—which was also in the Southwest—and, a competitor from Texas had moved in to their existing market and cut the client’s current market share. The client theorized that their overhead would allow them to move into Texas and severely undercut their competitor.
We looked at the data in a more wholistic way to allow the client a better idea of which markets hold the greatest opportunity. For this client, we assessed the competition, market size, and if there were state mandates for their service; all the aforementioned are included in the figure 1 model.
Everything to the left of where the two blue dashed lines intersect are potentially good markets for this client, the further left along the x-axis and up the y-axis the better. As you can see, Tennessee and Michigan are among the best new markets based on our criteria. California, has no state mandate, however, it has low competition and a tremendous market size making it a front runner as well. We discovered that although Texas has a large market size, it was not the best market to expand initially due to stiff competition and no state mandate. This simple dashboard saved our client a considerable amount of time and money that could be spent better in other markets.
Conclusion
Does your business need a dashboard to be successful? No, it certainly doesn’t. Businesses have been operating for centuries without the use of dashboards. But can dashboards help your business be more successful and competitive? Yes! We are in a time unlike any in human history. The amount of data that companies have access to about their industries, competitors, and customers is unprecedented. Even if you aren’t sold on the utility of dashboards, you can bet that some of your competitors are. And that should be cause enough to act.
Sources:
https://www.klipfolio.com/guide-to-business-dashboards
https://www.clicdata.com/blog/dashboards-useful-tools-business-organizations/
https://www.idashboards.com/blog/2016/09/26/what-is-the-purpose-of-a-dashboard-2/
https://www.yurbi.com/blog/business-dashboard-need-dashboard-software/
Tweet us @InfoWorksTN to join the conversation!