The Nashville Technology Council hosted their 4th Annual Analytics Summit on August 11-12 at the Omni Hotel, and I was one of over 400 attendees. The number of attendees has quadrupled over the last four years and this significant growth reflects the outstanding value attendees have gotten out of the event. This year did not disappoint. Here are my three takeaways that I’ve distilled from the many great sessions.
1. There is more to analytics than analytics
My favorite session was “how to present results that get results” by Lea Pica. Lea’s talk boiled down to how to give a great presentation, and she gave a great presentation. Lea offered great advice to help attendees hone their presentation skills in a way that would make them more effective presenters. Two pieces of advice that stuck with me. First, create ideas, not slides. Lea suggested using two slides to convey a single idea to pace your audience and build anticipation. Second tip, harness the power of real imagery. Lea shared that vision is the human being’s strongest sense and that using a compelling, relevant, and emotional image can increase recall for your audience. Overall, Lea rocked her talk and it was amazing how she cruised through 130 slides in about 45 minutes, and not once did I get the urge to check my phone or think about what might have arrived in my inbox.
2. Leave your analyst chair
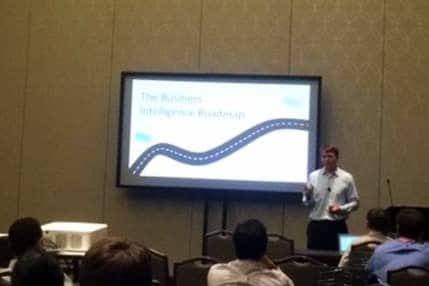
Nathan King from InfoWorks gave a great talk about developing an effective BI roadmap. Nathan challenged analysts to think out-of-the-box and to do things that might be out of the ordinary. Nathan explained how doing this would help the analyst design a more effective solution and roadmap for business intelligence. Nathan gave an example of what this could look like by suggesting that analysts join a sales person on a sales call. In most organizations, that would clearly fall out of their job description, but Nathan explained how analysts can really benefit from customer interactions and a better understanding of how business is conducted outside of their department.
3. Combining data sources doesn’t have to be complicated
I attended the Alteryx session and was really intrigued with their tool. Alteryx is a tool that allows analysts to avoid programming and complex systems integration by creating repeatable workflows with drag-and-drop functionality for self-service data preparation and data blending. The solutions engineer from Alteryx walked the group through the tool and helped us blend two different Excel spreadsheets. I was impressed that, even though I am a sales executive, I could very easily do this. This tool really makes combining data sources easy and I experienced firsthand the productivity increases it provides. I can see how this tool could help our clients and be an effective tool in the workplace.